Financial Insights from Off the Shelf Directional People Counter
Feb 09, 2018
Building software which cross references foot traffic with receipts for enhanced financial insights.
Project Summary:
Financial Insights from an “Off the Shelf” Directional People Counter Camera
Background Rationale
A friend of mine used to run events at a local downtown Minneapolis bar which had a huge amount of traffic, on the order of 1000 to 2000 people per night on Thursdays, Fridays and Weekends for various points in the year.
Running a restaurant or bar operation is very much a manual experience. While there is a huge amount of data existing in the, “air,” in terms of the number of people who attend the event, the times they arrive, as well as areas of the bar that they enter into, this type of information is expensive to collect because it would require paying a valuable extra person with a clipboard.
Bars, restaurants and clubs typically rely on approximations to understand how traffic flows throughout the night. Cue the people counter:
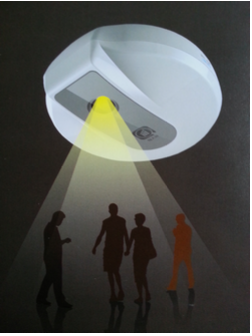
A tiny, directional camera which anonymously counts and, “directionalizes,” people’s movements from above, searching for the shape of the top of a head and shoulders and monitoring for movement. This is a device I bought in China on a trip in late 2015.
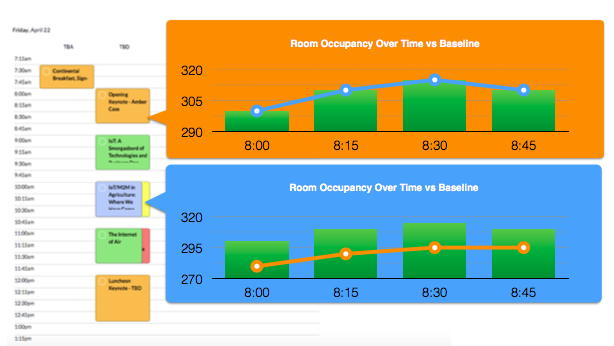
From the raw data fed off of this camera, which had its own cloud service built on AliYun, Alibaba’s cloud services platform, one could derive insights on quantity of people in a given room by adding and subtracting entries and exits throughout a defined time period, like so:
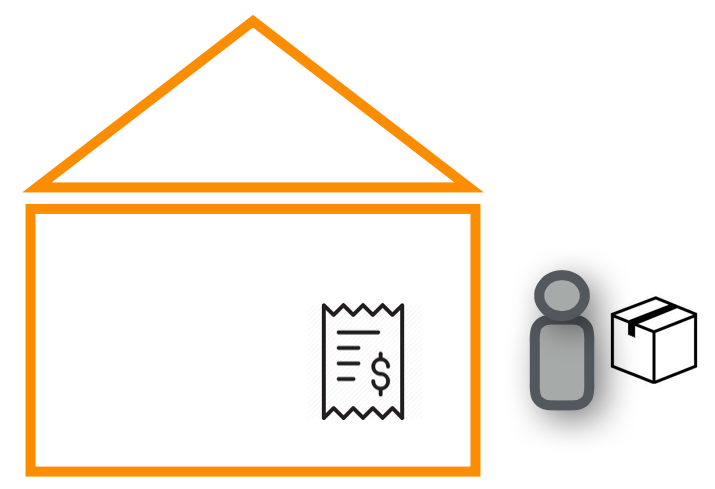
My thought was, could we create a, “Retail” themed internet of things innovation by comparing actual receipts with traffic, thereby having an idea of how many goods and services were purchased per person at any given time.
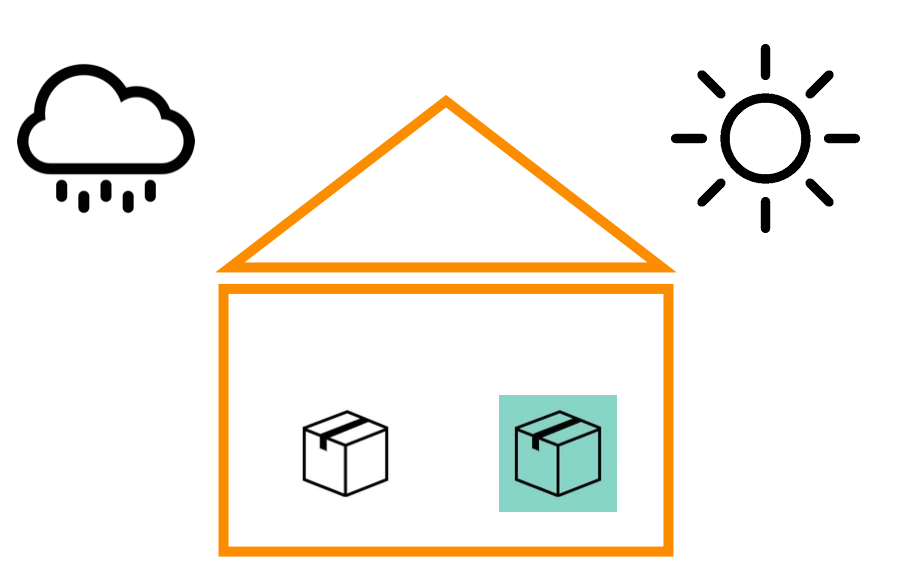
Further to this goal, once baseline purchase data exists for a particular facility or store, it could be interesting to compare and pull out purchase data against other forms of external data such as weather of seasonality to see what effects people’s buying behavior.
Benefit and to Whom
Long term, the idea would be to assist local retail establishments by giving them more insight into how food traffic impacts their sales. It’s easy to conceptualize how this works in China, where foot traffic volume is greater and online purchasing is much lower than the United States at the time of writing this document. What kinds of stores or facilities might find this information useful would require more market research. However my friend who operated this establishment was interested in the insights we might come up with.
Project Status or Outcome
So the three main inputs that I had were:
1.) Raw entry and exit data for a given night, captured through one of the “People Counter,” installations, downloaded from AliYun as a CSV file.
2.) Raw flat-file receipt information for various nights of operation, sent to the bar by their Point of Sale software company and captured through an application called Flamingo. This data was simply a long string of receipts, just like the type of receipt you would get at a restaurant, however on a massive .txt file showing receipt after receipt.
3.) A clipboard showing an hourly count done by a human with a handheld clicker. There was not a set protocol across different nights about how these workers would count people, but it was generally accepted that the clicker would only ever count up and not done, and would only count entries but not exits.
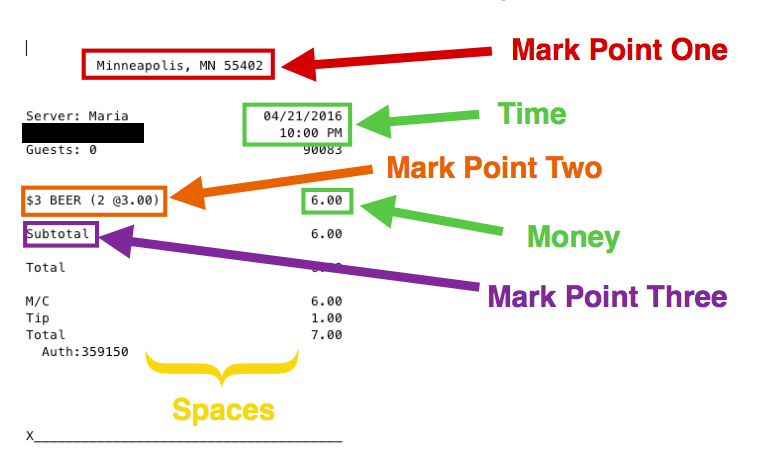 One piece of the enormous reciept flatfile
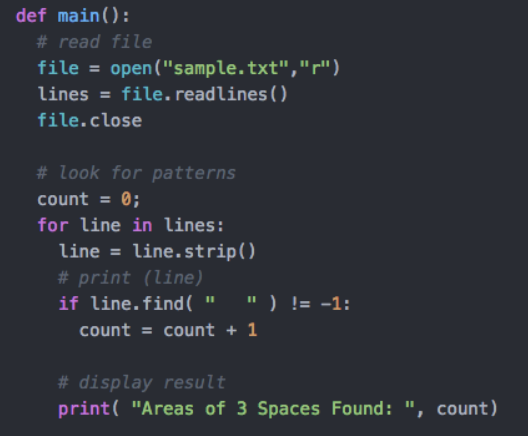
So the first step was to parse the extremely long receipt flat-file, which I accomplished in a few python functions. The first python function separated out data line by line, as shown below. Other parts of the function separated out the key datapoints, transaction amounts and timestamps, using the mark-points shown in the receipt image above.
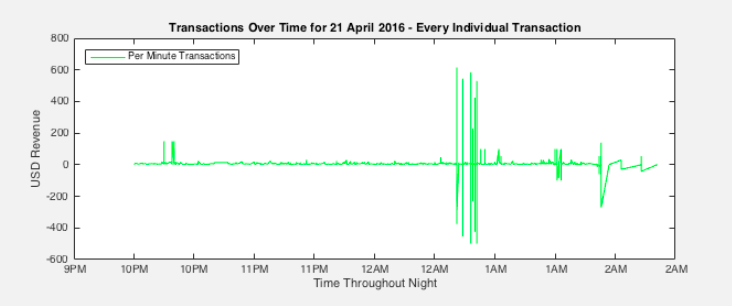
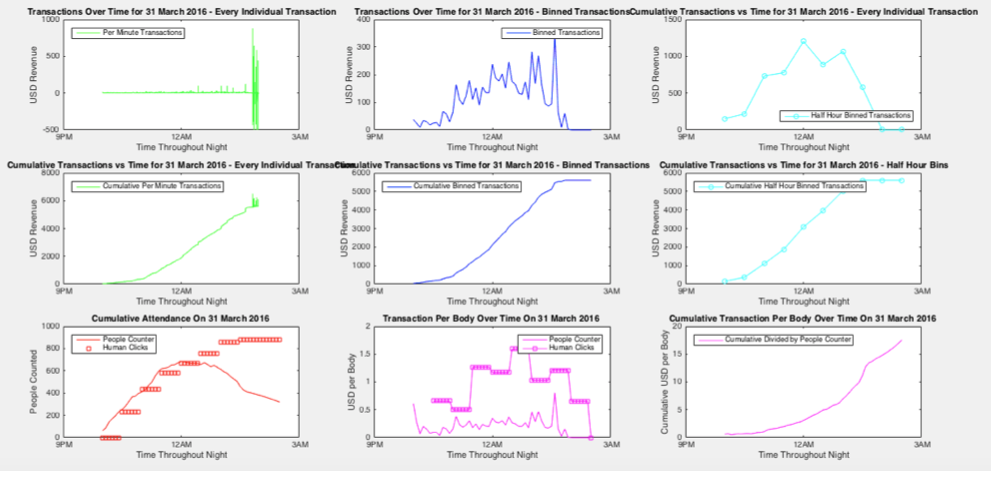
Graphing all of the transactions by volume on a time series plot representing the night, with the Y-axis representing volume, we could see that there were a few key points with a huge number of transactions, or perhaps large transactions coming in all at once, as well as some negative transactions. Asking the bar what these transactions were, I found out that this was a way to reconcile group orders and many receipts and orders which were received and written down, but not rung up until the end of the night. One example of such transaction would be someone with a tab and a number of discount tickets for drinks, or discounts given for having run up a tab.
Graphing out everything as a cumulative chart for the night, we see a huge number of orders placed right off the bat, a nice, upward sloping graph with net positive money coming in as the night progresses, some reconciliations and tab closings part way through the night, and larger closeouts toward the end of the night.
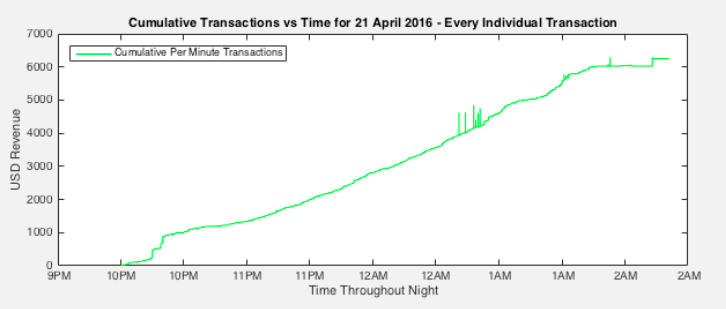
This above chart is interesting in it of itself, but to gain even finer grained insights, it would be necessary to establish a population count at every given hour or minute of the night to help understand more about purchasing behavior per person throughout the night.
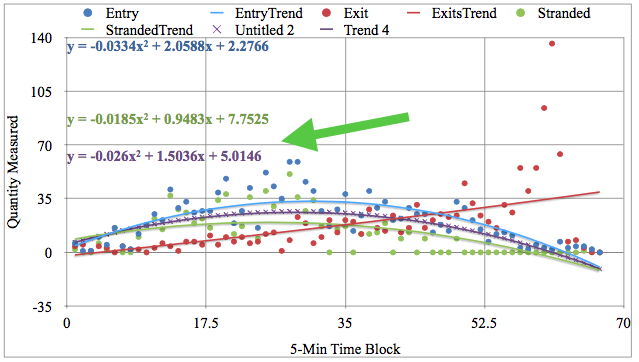
The below output shows an analysis of several different types of data derived from the raw CSV output coming off of the People Counter. The People Counter does not simply output a nice, clean population profile for you, it gives several classes of data, including an, “up” direction and a, “down” direction count as well as a datapoint representing an unknown or, “stranded” person, if the person enters into the screen but does not exit through the other side within a given timeframe.
Therefore, the data scientist, e.g., I - had to decide how to create a population count based upon the context of what was going on at the time. I built several different models and picked the most reasonable one after discussions with the bar managers.
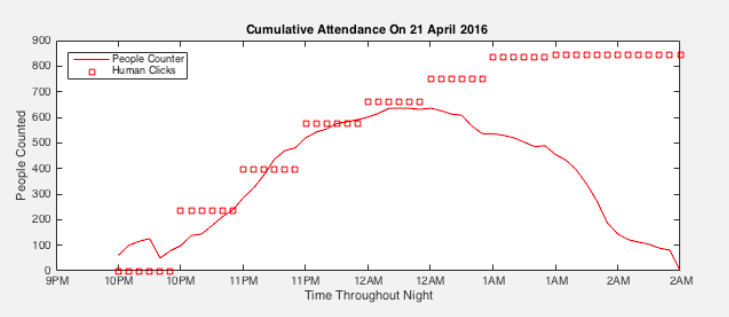
From there, I was able to come up with a cumulative attendance graph based upon entries and exits through the main door, which is shown in the below figure as a solid line. The peak population at around midnight to 12:30AM was about 600 people for this particular night. The, “human clicks,” measurement shows a reference measurement given by a human person holding a clicker at the door. These counts were known to be inaccurate because the person at the door would only ever count upwards and not downwards for people exiting the bar, and there was often a lot of in and out traffic.
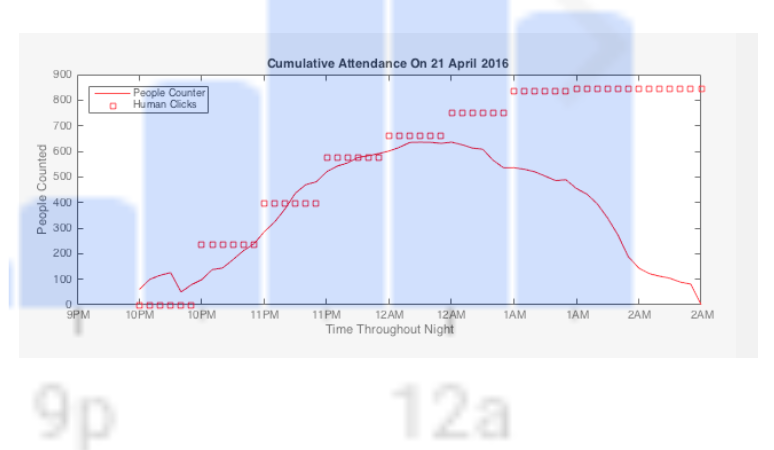
Overlaying this graph with Google popular times, we were able to see that our curve matched up with Google’s relative count. Google does not give an exact number, but we may accept their count as fairly reliable as they are basing traffic after handheld devices. As can clearly be observed below, Google shows a maximum population footprint at that midnight to 12:30AM timeframe, just as our People Counter coupled with our specifically designed algorithm shows.
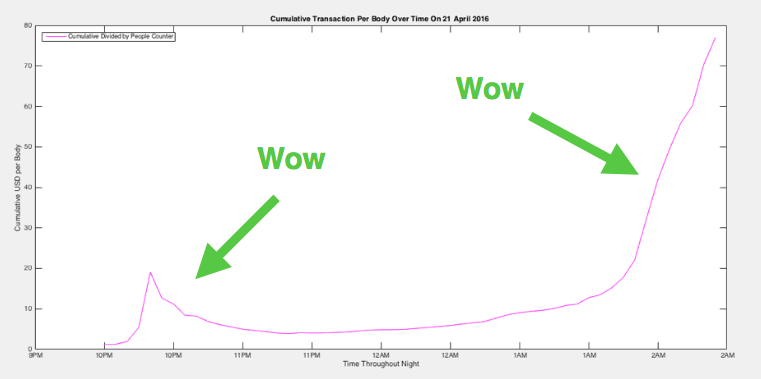
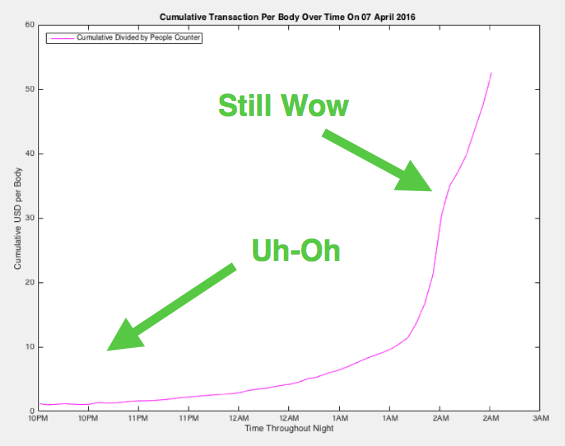
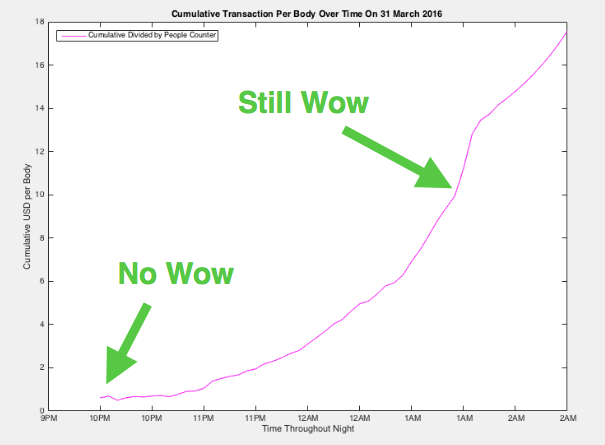
Next, for the exciting part - doing an analysis of how the transaction volume stacks up against the number of people at the bar. What was interesting to see is that there was a high, “per capita,” transaction rate at the start of the night as well as the end of the night. The graph Y-axis shows USD Per Person every five minutes.
Were these spikes abnormal? It was necessary to capture data across multiple different weeks to understand and see if there was a generalizable model or if this was a one-off night. Below shows a couple more different nights.
Stacking the nights against each other for the same time periods on the same graph, we were able to see that the initial spike only occurred on one of the nights. The reason for this was because there was an early concert with a large audience immediately prior to the event start time for that one particular night, meaning that there was already a large number of people, or perhaps better stated an, “initial load capacity,” in the room.
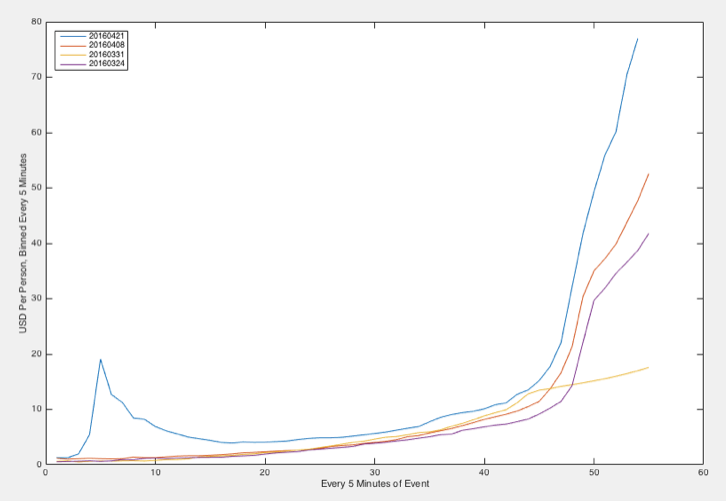
There are lots of other ways to look at these two streams of data and I have provided a sampling of some different methodologies below. However this was more or less a hobby or mad engineer project and as such I really didn’t want to spend too much time working on this. However there was a key insight found from the above graph:
The transaction per person toward the end of the night was consistently high, which did not match up with how staff was trained in terms of treating end of the night customers.
Indeed, there was no training at all in how to treat end of the night customers, because no one had ever thought that they were valuable. As a result, since staff was eager to get home and close things out, as staff normally are in any type of job toward the end of their shift, they typically treated these customers more, “rudely,” or perhaps “curtly,” to get them out the door. Interestingly, the money coming in at this time was from higher paying customers on at least a per-person basis.
Another way to think of this would be:
- If you, as a bartender sell a beer to a customer at midnight, the chance that this person paid a lot at this establishment, or even paid a lot to you personally, was lower because the per capita transaction amount was low. At this point in the night, people were buying one beer per person on average, or around $7.
- However, since the crowd is large and people are generally having fun, are not too rowdy yet, and your shift hasn’t gone on for too long, you are likely to be very cordial to them and give them a great experience.
- On the other hand, toward the end of the night, any given customer is likely to be a much higher dollar customer because the transactions per person are coming in at the $50 to $100 mark.
This makes intuitive sense because people who like to party or like your establishment and spend more money on these types of things are likely to stick around longer, they get more value out of the experience than the person who hypothetically buys a beer and then exits after an hour.
However this particular bar was, according to the manager, in some cases downright mean to the end of the night customers. This included customers who came after or close to closing time at 1:50AM or 2:15AM, because they had forgotten their card and went to another bar.
“Come back tomorrow,” these high value customers were told. There was no protocol to have any staff member stick around any longer than anyone else had to, for any reason. The protocol was to have everyone close up shop and leave and go home.
After this analysis, the bar changed their operations, treated the end of the night customers better, assigned specific staff to stay until 4AM for cleanup and late-customer service and even gave away any extra gifts that they may have had from the night to the end of the night folks who stuck around. This later lead to increased Google and Facebook ratings for the bar and bar events.
The end take away form this exercise is that sometimes we take things for granted, and simple automated data collection can help us get a better handle on the unseen, and improve not only on the cost saving side, but also on the improved value, service and revenue side of our businesses.
Check out my Portfolio
Internet of Things, Machine Learning
Share